Simulating Groundwater Recharge Variability in the American-Cosumnes Groundwater Basin, CA.

Hydrogeology Journal MAR paper
Maples et al. (2019)

HESS Sensitivity Analysis Paper
Maples et al., (2020)

2018 AGU Presentation

2017 AGU Presentation

2017 AGU ePoster
Decreased snowpack storage and groundwater overdraft in California has increased interest in managed aquifer recharge (MAR) of excess winter runoff to the Central Valley aquifer system, which has unused storage capacity that far exceeds the state’s surface reservoirs.
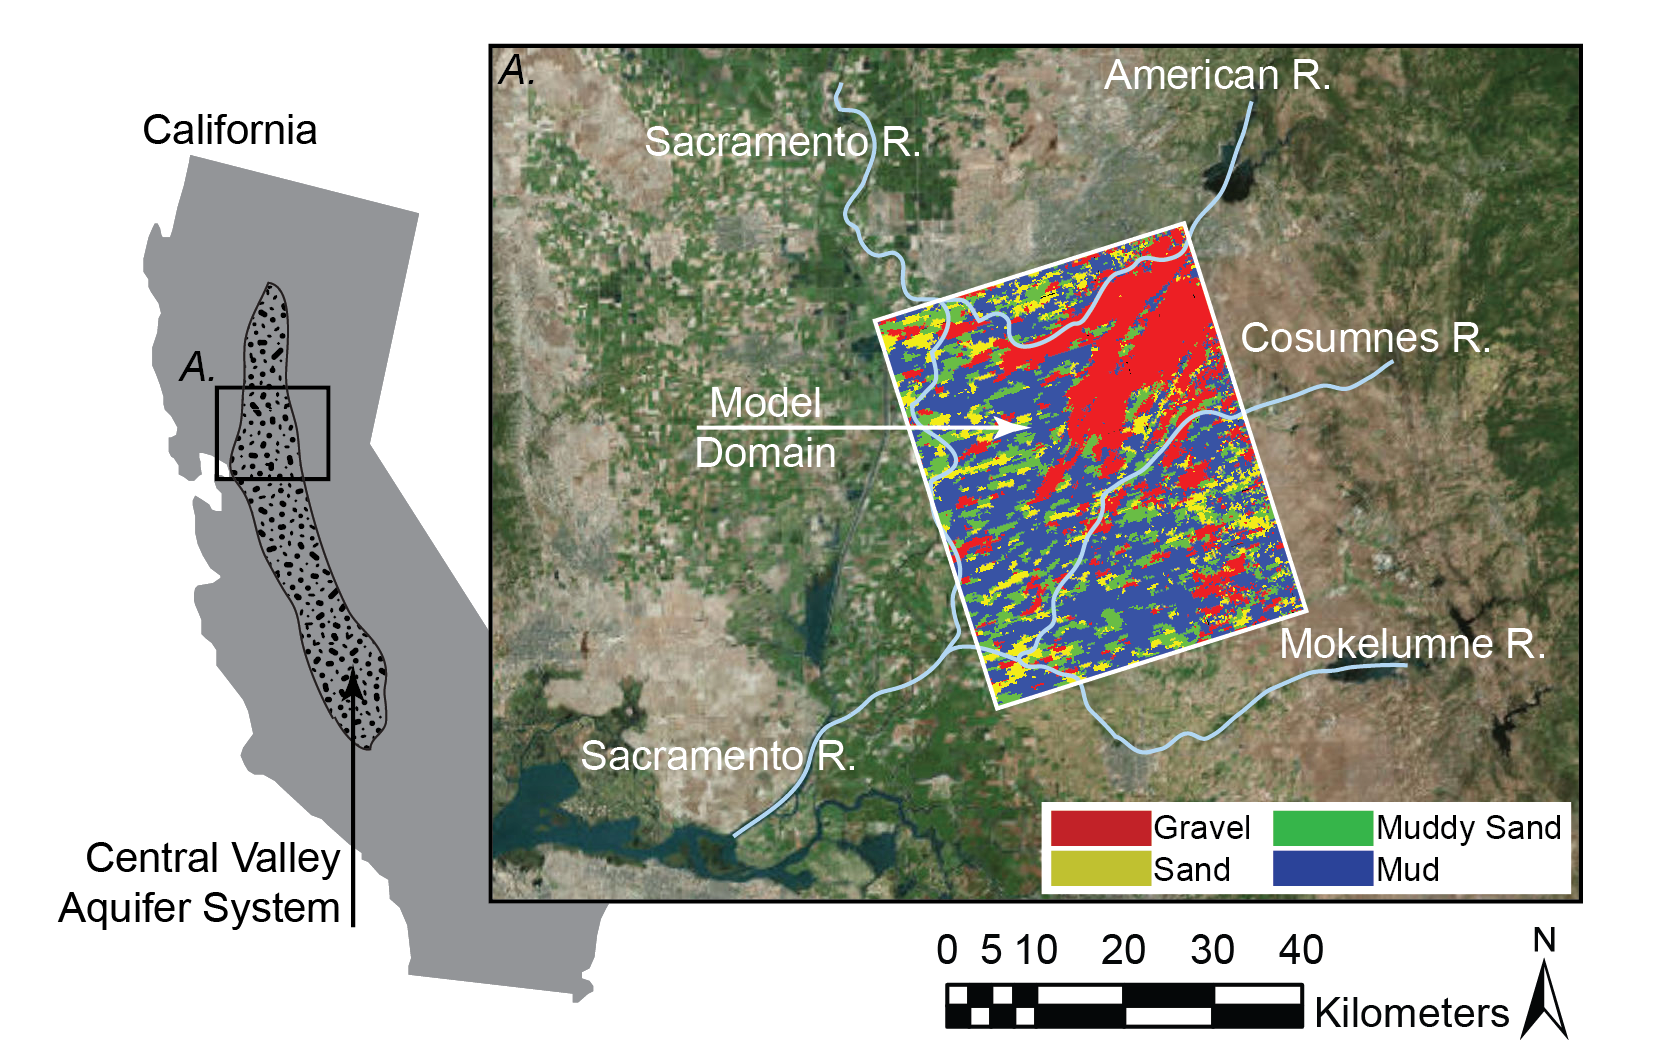
Location of model domain in the in the Central Valley aquifer system, and (A) inset of the uppermost layer of the model hydrofacies overlain over aerial imagery of the Central Valley and local river systems.
Recharge to the productive, confined aquifer system remains a challenge due to the presence of nearly-ubiquitous, multiple silt and clay confining units that limit recharge pathways. However, previous studies have identified interconnected networks of sand and gravel deposits that bypass the confining units and accommodate rapid, high-volume recharge to the confined aquifer system in select locations.
We use the variably-saturated, fully-integrated groundwater/surface-water flow code, ParFlow, in combination with a high-resolution, transition probability Markov-chain geostatistical model of the subsurface geologic heterogeneity of the east side of the Sacramento Valley, CA, to characterize recharge potential across a landscape that includes these geologic features.
Five 180-day MAR simulations show that recharge potential is highly dependent on subsurface geologic structure, with a several order-of-magnitude range of recharge rates and volumes across the landscape.

Three-dimensional representation of the model domain with insets of (A) sites 1–3, (B) site 4, and (C) site 5, where the semi-transparent gray boxes outline the locations of the recharge sites.
Where there are recharge pathways to the productive confined-aquifer system, pressure propagation in the confined system is widespread and rapid, with multi-kilometer lateral pressure propagation. Although widespread pressure propagation occurs in the confined system, only a small fraction of recharge volume is accommodated there. Instead, the majority of recharge occurs by filling unsaturated pore spaces. Where they outcrop at land surface, high-K recharge pathways fill rapidly, accommodating the majority of recharge during early time. However, these features become saturated quickly, and somewhat counterintuitively, the low-K silt and clay facies accommodate the majority of recharge volume during most of the simulation.

Animation of pressure perturbation for 180-day recharge simulation at Site 2 (more videos included in link below).
These findings (1) highlight the large variability of MAR potential across the landscape, wherein the recharge capacity in select areas far exceeds recharge potential over most of the landscape, and (2) elucidate important physical processes that control MAR potential in alluvial aquifer systems.